
See what comparable nonprofits pay their executives
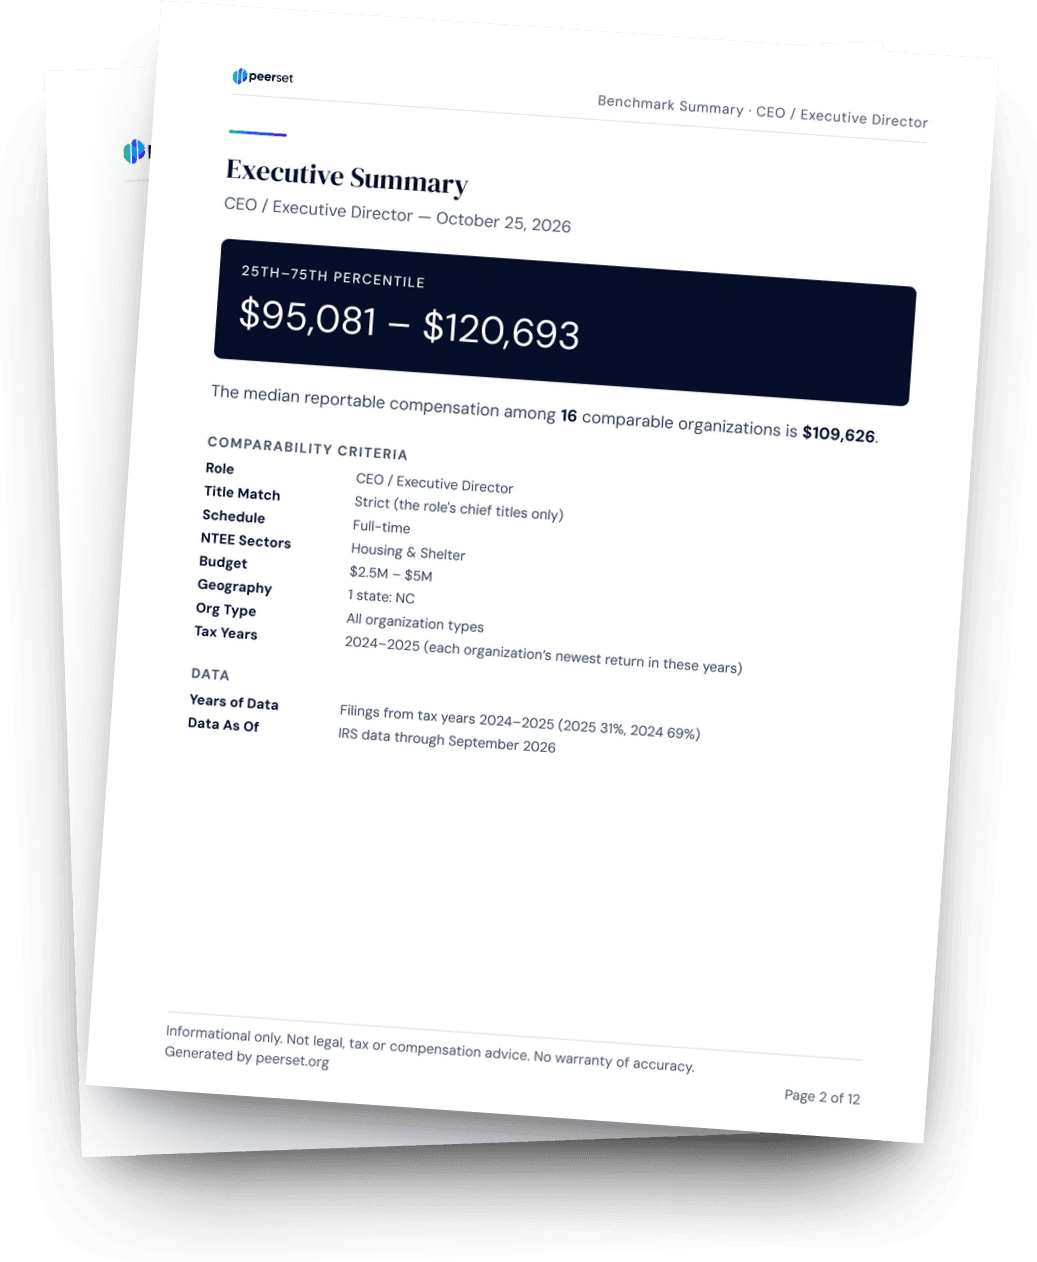
Pick a role, sector, budget size and location, and PeerSet shows the pay range at matching organizations from their IRS Form 990 filings. You can download the summary as a PDF.
Free. No account needed for the PDF.
1.3M+
Form 990 filings
2023–2025
Tax years covered
13
Executive roles
50 states
National coverage
How PeerSet works
Define your criteria
Select the executive role, work schedule, NTEE sector, budget range, geography and tax years.
Refine the peer group
Review the matching organizations with their reported compensation. Adjust the filters to narrow or widen the set, and compare across tax years.
Export your analysis
Download the Benchmark Summary PDF. A free account adds the CSV.
What you'll see
Compensation Summary
CEO / Executive Director
847 matching organizations
Median
$187,400
Mean
$203,100
P10
$98K
P25
$142K
P75
$248K
P90
$325K
Compensation Distribution
Reportable Compensation
Sample data shown for illustration.
See a sample Benchmark Summary
The PDF has the pay percentiles, a chart of the range, your search criteria, the methodology and, for 50 or fewer, every matching organization.